
Real rates have turned positive in the US—at least officially.
Given all the years we’ve heard legendary speculators like Rick Rule say they’re bullish on gold as long as real rates are negative, this is a sea change that must not be ignored.
I remain bullish on gold, and I’ll tell you why, but first, a quick refresher…
The US dollar was defined as a certain amount of gold at inception. After taking gold out of physical circulation in 1933, President Franklin Delano Roosevelt changed that definition, devaluing the dollar by 59%. President Richard Nixon finished the job of debasing the dollar in August of 1971 when he removed its gold backing entirely. The greenback became a “floating abstraction.”
This was after the 1944 Breton Woods agreement, which set in motion the adoption of the US dollar as a global reserve currency and means of settling trade. It replaced gold, which had filled these roles for centuries. This worked because the dollar was seen as being “as good as gold” then. And actual gold was hard to come by as WWII wrapped up. Thus, when Nixon took the US off the gold standard, he really severed the entire world from any physical constraint on how much politicians could print and spend.
This could easily have been a more explosive event, but the US got the Saudis to accept only US dollars for oil. The petrodollar system—and the US being the only global superpower—made other countries toe the line.
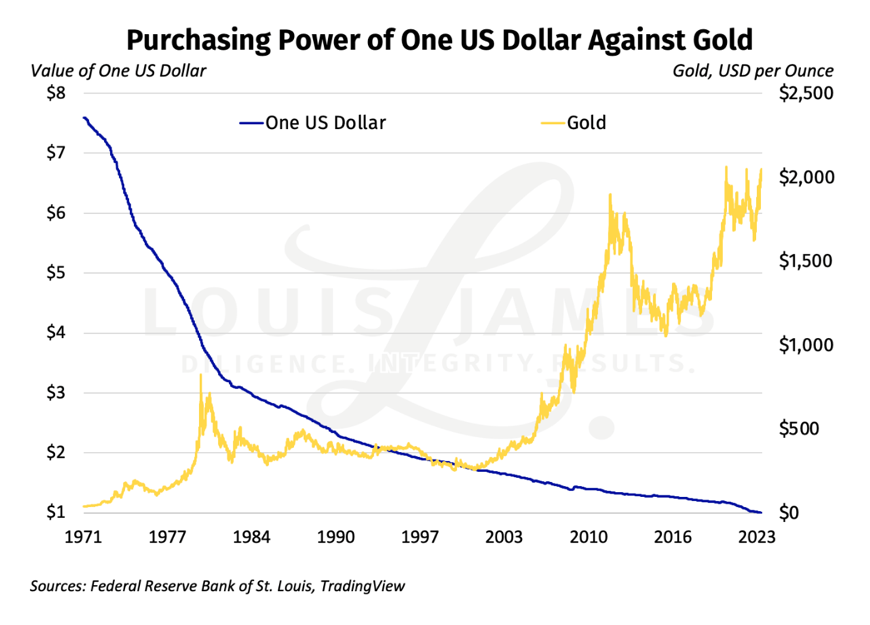
Since 1971, the gold-dollar exchange ratio (aka the “price of gold”) has fluctuated chaotically over shorter time periods. Over the decades, it has risen as the dollar has lost purchasing power due to monetary inflation, which resulted in price inflation.
Meanwhile, an ounce of gold remains an ounce of gold. It has similar utility and purchasing power as it’s always had.
The dollar, despite losing an enormous amount of purchasing power, retains utility due to government fiat and “strength” in foreign exchange markets due to other countries gutting their currencies purchasing power just as quickly—if not faster.
It’s not a semantic game, but an important statement of reality to say that it’s not gold that has risen but the dollar that has fallen. The inverse relationship has a solid inverse correlation of -0.63, shown on the chart below.
Given this strong relationship, people are often puzzled why gold, which is “priced” in dollars like other commodities, doesn’t trade inversely to the dollar. The correlation between gold and the DXY Dollar Index, the most widely used measure of the “value” or “strength” of the dollar, is -0.35 over the same time period. Yes, it’s negative, but not strongly so.
This is because the DXY is the wrong yardstick, or, as I call it, The Wrong Trousers. How well or poorly the US dollar is doing compared to other fiat currencies has little to do with its actual value—purchasing power. This explains today’s insanities, such as dollars, euros, and other currencies “rising” when their issuing countries are experiencing high inflation (real loss of value). Traders care more about how central bank reactions compare to each other than actual value.
So, if the reality is about purchasing power, shouldn’t gold—a famous inflation hedge—trade inversely to CPI?
One might think so, but gold tends to lead CPI. We just saw this in spades, with gold leaping in 2020 and inflation not soaring until 2022. Since 1971, the correlation here is small and negative: -0.28. Unlike gold and the dollar, this correlation between gold and CPI should be positive, not negative, if they moved together. But since it’s anticipated inflation that moves gold in forward-looking markets, we see a weakly negative correlation with CPI.
With the DXY and CPI not helping much, we need to look elsewhere for what makes traders buy and sell gold. Since forward-looking traders care less about purchasing power today than tomorrow, it’s central bank monetary policy that’s seen as the key factor. The conventional wisdom, however, is that it’s real rates—not nominal rates—that matter most.
When I first started in this business almost 20 years ago, my mentors and peers all pointed to real interest rates as being the single most powerful driver for the gold-dollar exchange ratio. I’ve said so myself in more interviews than I can count.
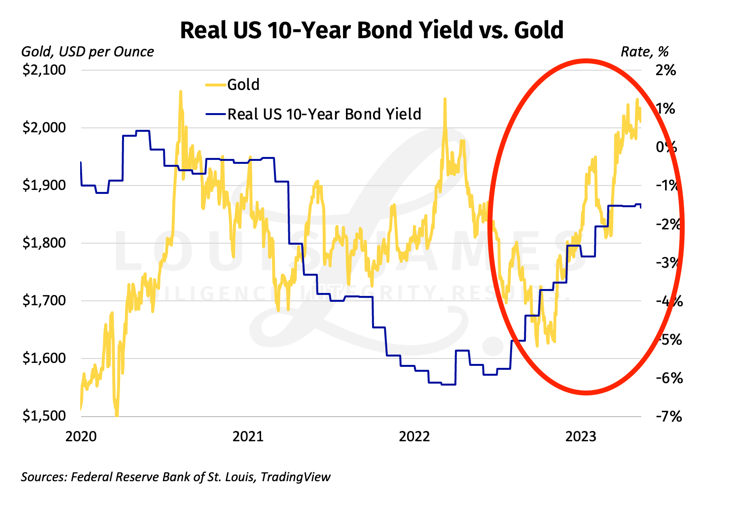
We can see this relationship in recent market action. However, gold and real rates, based on the US 10-year benchmark, had been rising together since late last year, until just the last few weeks (red oval on the chart below). I’ve been commenting on this change in the Speculator’s Digest. If the recent change means real rates are about to turn south, it should be bullish for gold.
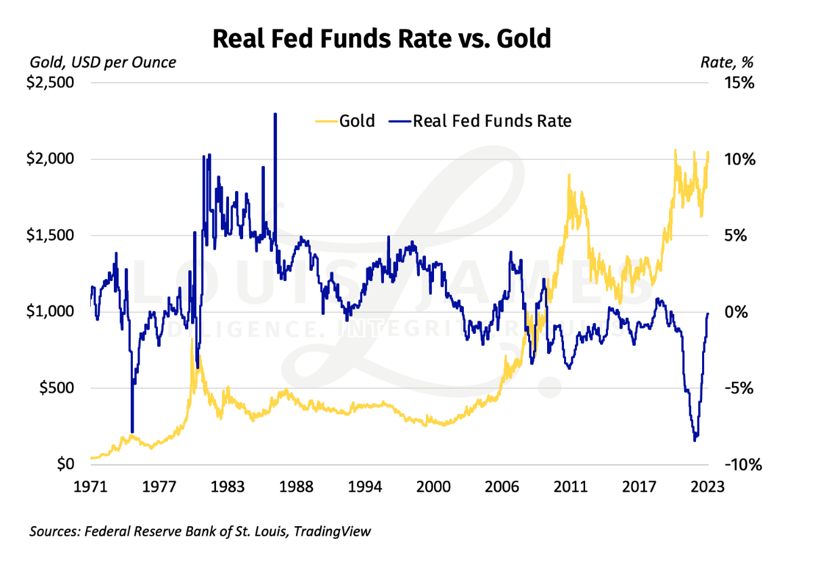
But if we use the Fed Funds Rate to calculate real rates, the recent divergence disappears.
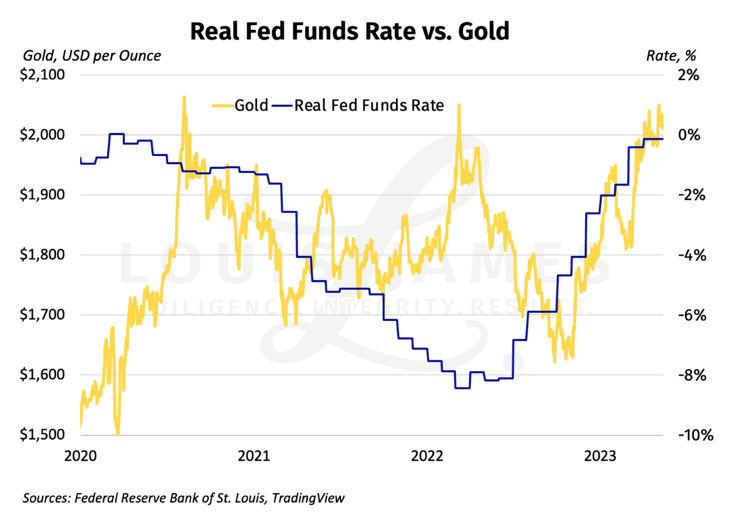
As you can see, gold and the real Fed Funds Rates have moved upward together for much of this year, which is not what they are “supposed” to do. So, I also looked at the nominal 10-year rate versus gold. This is what traders seem to respond to the most (when they’re not distracted by The Wrong Trousers) in between CPI prints. This looks to be a more closely inverted relationship than I expected, so I checked the chart for the nominal Fed Funds Rate as well.
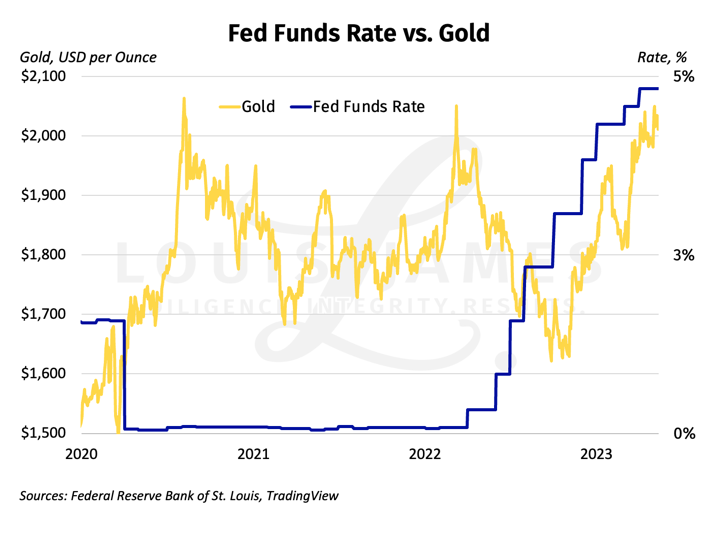
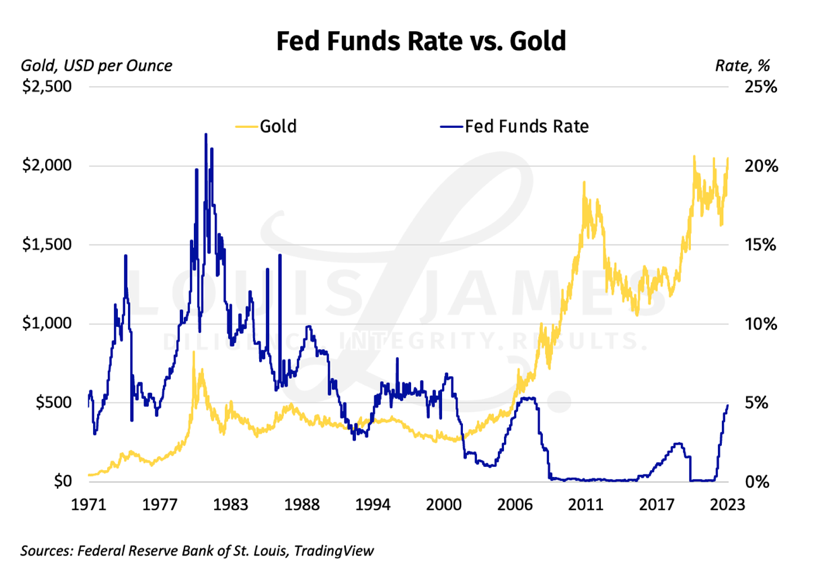
No surprise: this one’s wacky. The years of rates held near zero don’t give us much signal (and the recent rally with gold contradicts conventional wisdom).
As a quick aside, that long flat period near zero is the basis of my pet theory as to why COMEX gold traders started looking to the DXY instead of rates for signal. Rates were useless for providing pricing information.
At any rate, the surprisingly strong relationship in the nominal 10-year rate vs. gold made me ask a heretical question: what if real rates are not the strongest explanatory variable after all?
To answer, I looked at the same charts, going back to August of 1971, when Tricky Dick Nixon ended the era of the dollar being “good as gold” and ushered in the era of the dollar being “good as government promises.”
Bear with me, as I have to show you a bunch of charts to make my point. We start with the real 10-year rate versus gold for the entire period.
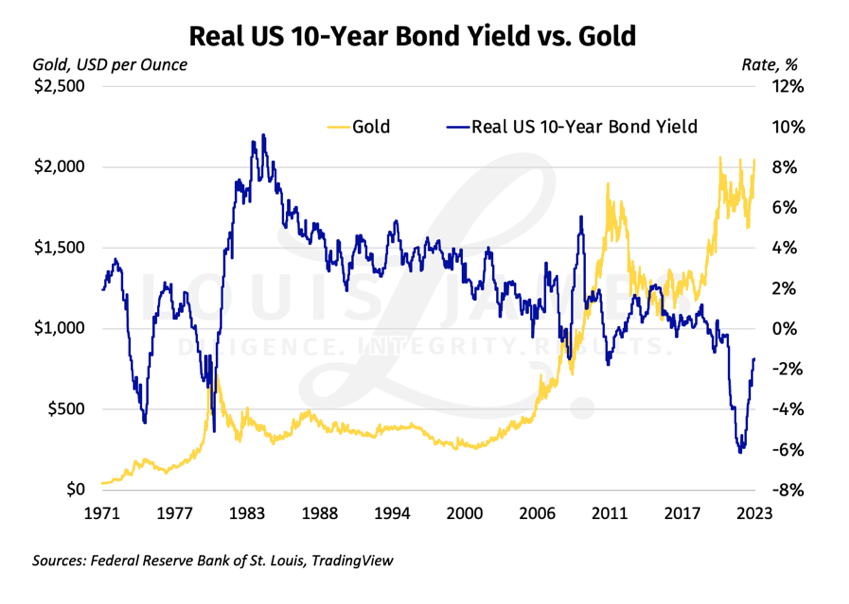
As you can see, the inverse relationship is there, but the long slide from 1984 to 2007 (or until now, if we ignore the big fluctuations) confuses the picture.
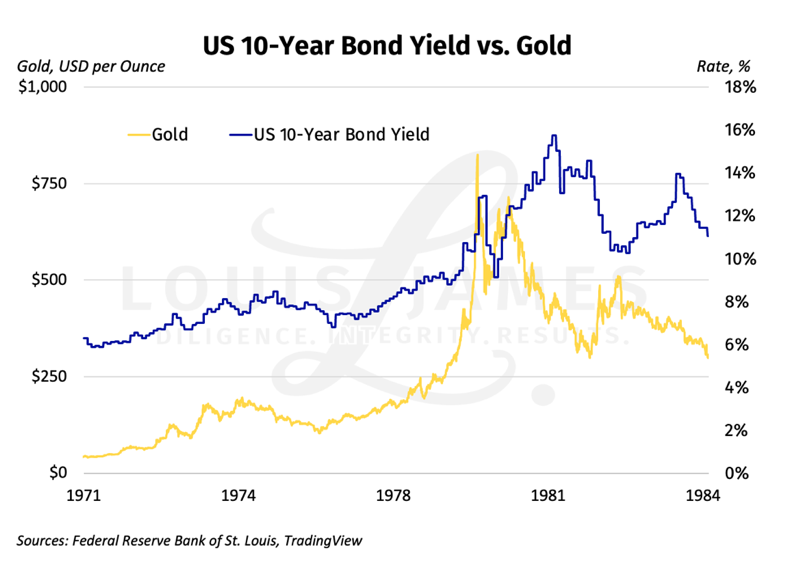
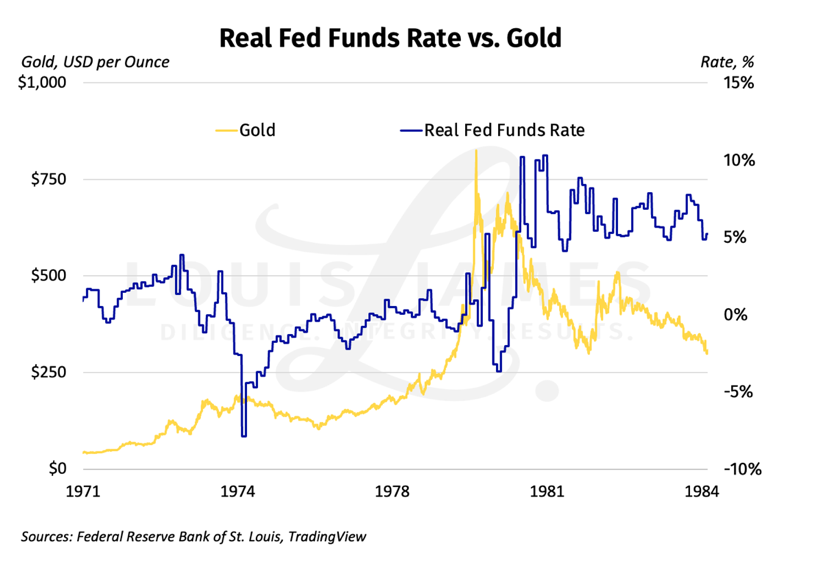
Below is the chart of the nominal 10-year rate versus gold over the same period. It looks less compelling because the huge Volcker-era nominal rates change the proportions on the chart, but the inverse relationship is still there. (The current upturn in rates also looks more like a turning point than anything we’ve seen since the early 1980s.)Here’s how it looks if we consider the real Fed Funds Rate versus gold for the entire period. The inverse relationship is more clearly visible.
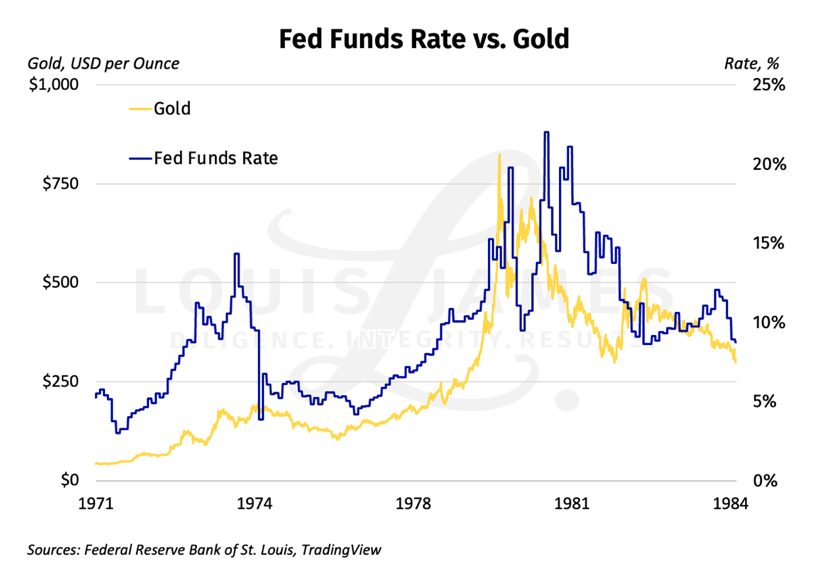
And here’s the same chart of the nominal Fed Funds Rate versus gold. Fed intervention since the GFC has clearly muddied the relationship.
Of these 1971–present relationships, the strongest correlation is between gold and the nominal 10-year note: -0.69.
In contrast, the correlation between gold and the real 10-year rate was only -0.49.
This is not at all what I expected.
We see the same pattern in the correlations between the Fed Funds Rate and gold. It’s -0.59 for the nominal rate and -0.53 for the real rate.
What’s going on here?
Not wanting to leave any stones unturned, we also looked at the 1-year, 2-year, and LIBOR. Unfortunately, the data for LIBOR stop in 2017, and the data for the 2-year start in 1988. The latter is a pity, since the correlation between gold and the nominal—not real—2-year rate since then is the strongest of all: -0.72.
Nominal rates are not “supposed” to move gold more strongly than real rates. Were my mentors wrong?
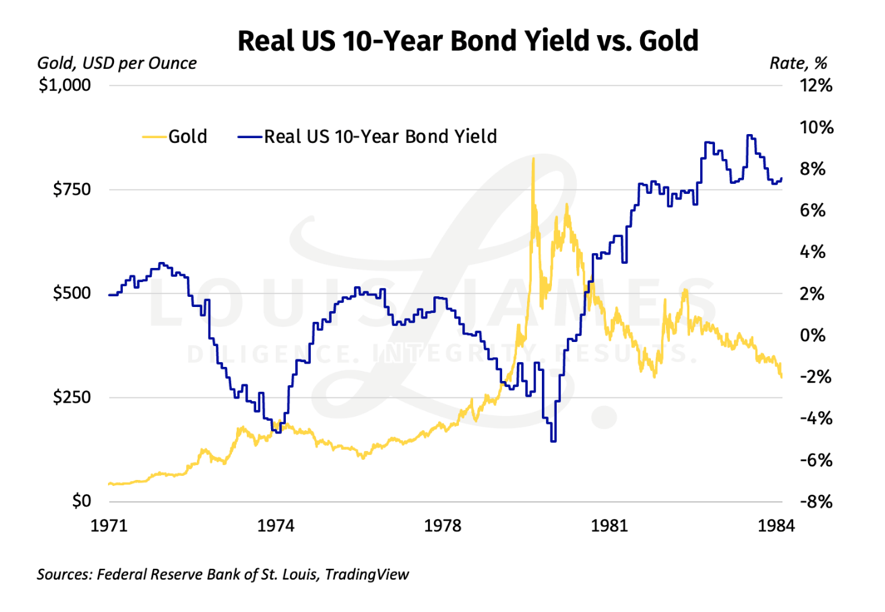
Searching for an answer to this, we looked at how rates and gold behaved in the great bull market of the 1970s and its unwinding in the yearly 1980s.
Here’s the real 10-year versus gold for just that period. As you can see, the relationship looks strongly inverted.
Here’s the nominal version, which looks positively correlated until 1980 and negatively correlated after 1980.
Here’s the real Fed Funds Rate version, which again looks inverted until 1980.
And here’s the nominal Fed Funds Rate version, which looks strongly positively correlated (+0.73, in fact).
The details of the correlations get messy. It depends a lot on which time frames we pick. (It hurts my brain to even consider what throwing silver into the mix would do.) Since this is not a scholarly paper on the subject, I’ll just summarize by saying that I can see why my mentors found that real rates were the main drivers of the gold-dollar exchange ratio as a result of the great gold cycle of the 1970s and 1980s.
I can also see that the nuclear winter of the 1990s and the calm before the storm in the 2000s (when I got into the business) did nothing to change this.
But it seems clear now that the crash of 2008 and the ensuing GFC changed more than we realized. I’m chagrinned that I didn’t go back and check the real rates premise until now.
Does this mean that we should ignore real rates and just look to nominal rates for guidance going forward?
Maybe.
Or maybe now that rates are normalizing, real rates will take over again.
What’s clear is that we can’t rely on conventional wisdom on this subject at this time—we can’t just assume that real rates will be the most powerful drivers.
In retrospect, this seems obvious to me now, here in uncharted waters.
Mea culpa.
We’ll just have to see how this develops. For instance:
- If gold goes back to tracking real rates, the Fed holding rates steady at around 5% while base effects continue chipping away at CPI is bearish for gold in the near term.
- If gold tracks nominal rates and the Fed holds rates steady at around 5%, it’s neutral for gold.
I’ll be watching with great interest and adjusting my tactics accordingly.
![]()
P.S. To be kept abreast of more dangers, opportunities, and issues affecting investors, please sign up for our free, no-hype, no-spam, weekly Speculator’s Digest.