
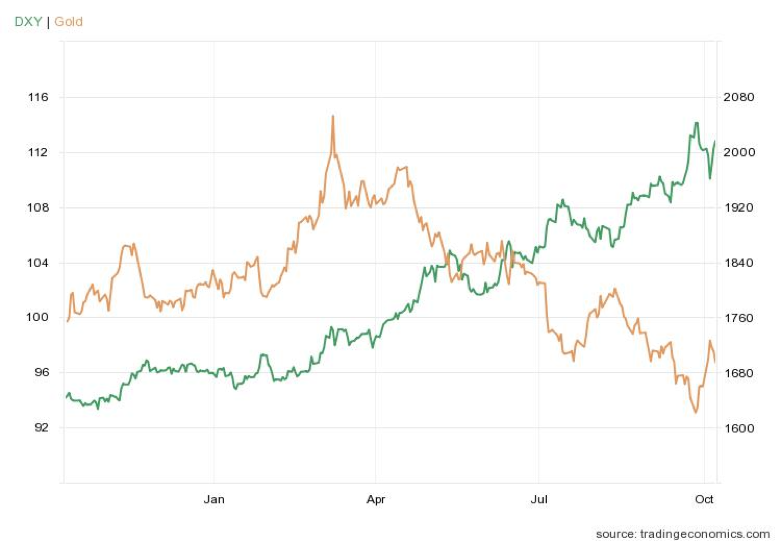
The invasion of Ukraine last February sent both gold and the US dollar higher, as demand for safe-haven assets soared. Sadly for gold bugs, moments of fear like this tend to be fleeting, and this was no exception.
Ever since it became clear that the conflict would remain constrained to Ukraine, the “strength” of the dollar on foreign exchange markets has been a major headwind for gold. The gold-dollar exchange ratio has become an almost perfect mirror image of the most-cited dollar index, the DXY.
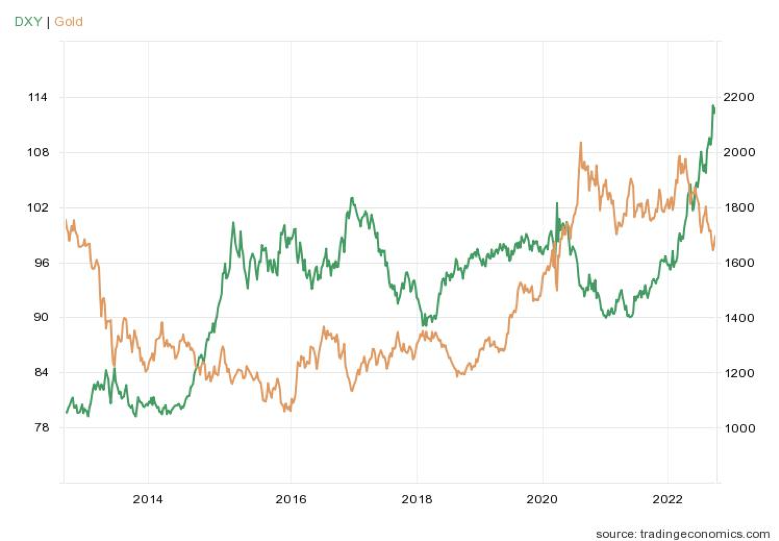
If we widen our view to the last 10 years, we see the same inverse pattern—and the DXY at what seems like an extremely high valuation, ripe for correction.
But let’s pull back to the largest relevant picture: the time since the dollar ceased to be defined as a certain amount of gold in 1971. It turns out that the dollar has risen much higher in previous bouts of foreign exchange strength.
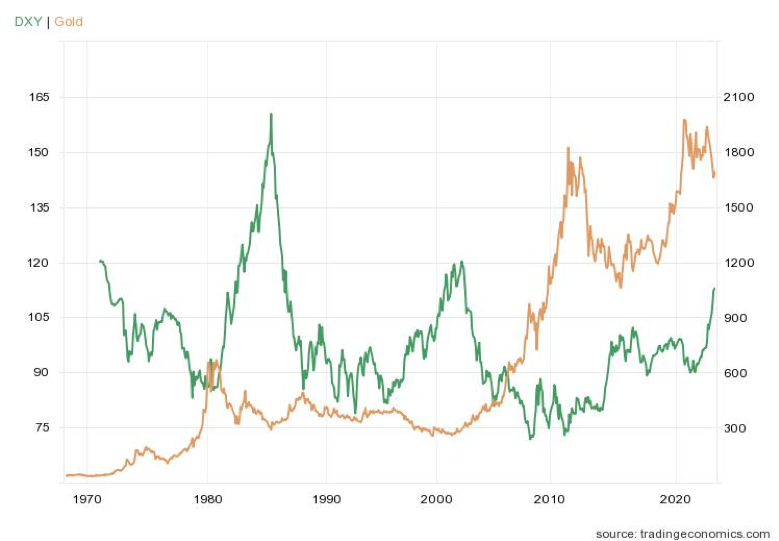
It’s notable that the huge surge in the 1980s was the Volcker era. It’s tempting to draw a resistance line at about the 120 level, but it’s an artifact of the data that the starting point near that level coincides with the 2001–2002 peaks. The average—no surprise—is just over 100.
Though not extreme, this does make the dollar look overbought now—and ripe for correction.
The Trading Economics chart above may make gold look overbought as well. But remember that the DXY compares the dollar to a basket of currencies that are all inflating. That’s a sort of built-in adjustment for inflation and why the overall DXY trend is basically flat. Gold is not adjusted for inflation by Trading Economics, so we’ve redone the chart with Fed data, adjusting for inflation.
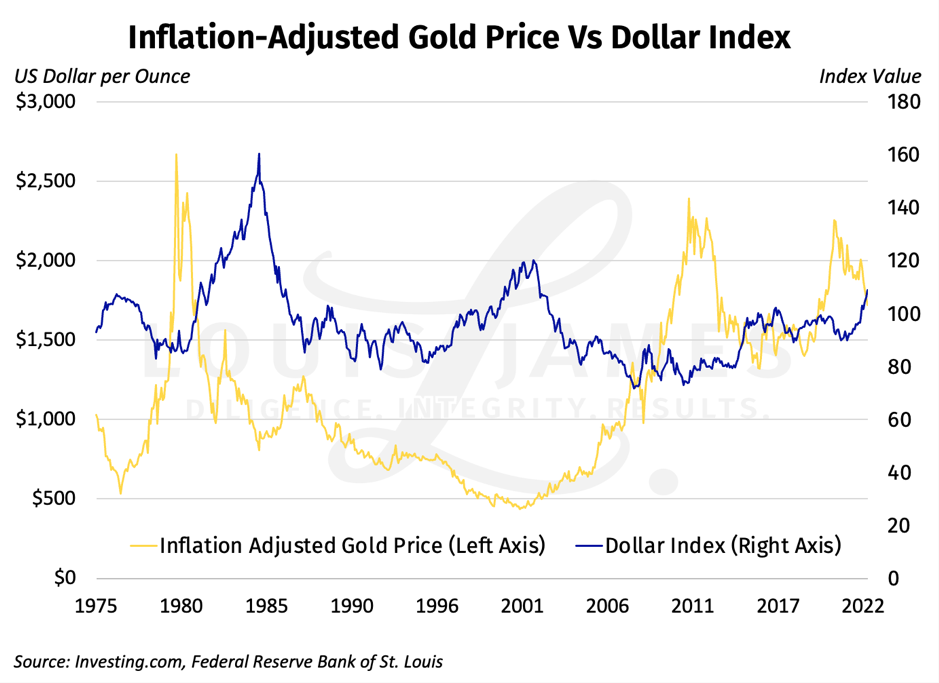
The long-term DXY trend remains flat, as all fiat currencies are inflated over time. The dollar is currently losing the race to debase, and hence heading for a new peak on forex markets.
In real terms, gold has yet to reach new all-time highs. It looks elevated, but less overbought.
But wait, I’ve called the DXY the “wrong trousers,” as the dollar’s value relative to other fiat currencies has nothing to do with the value of gold. Gold does and should reveal how much value those currencies lose, but the US dollar’s standing in the race to debase should not be much of a consideration at all.
Why then does this chart show such a strong correlation?
Actually, it doesn’t.
The directional changes are highly coincident, but they are of very different magnitudes. This results in a correlation coefficient of only -0.29. By contrast, I’ve seen gold’s correlation with real interest rates cited at -0.82.
This tells me that I’m right about the DXY having little to do with the value of gold. Despite this, futures traders take it as an input variable anyway—and it’s futures contract trading that most people quote for gold prices.
Trends in the DXY—especially turning points—have predictive power for the gold-dollar exchange ratio.
Looking at these charts, it’s clear why gold has been retreating this year; the DXY is on a tear. There’s no use sticking our heads in the sand. As long as this continues, the wrong trousers will remain a headwind for gold (and hence silver).
The news is not all bad, however.
Last week (early October 2022) the British pound rebounded after the Bank of England (BoE) intervened to halt a sudden dramatic decline. A new government budget spooked markets and threatened major pension funds, which dropped the pound to almost parity with the dollar. When the BoE stepped in, the pound rebounded. The euro moved in sympathy. The DXY moved inversely—and gold soared when it did.
This “Lehman moment” for the UK was proof of concept that the dollar milkshake mechanism is reversible—and very bullish for gold when this happens.
Proof of concept doesn’t put bread on the table. I understand. But I’m highly confident that the DXY will reverse at some not-too-distant point in the future. That will be very good news for gold, silver, commodities in general, and all real assets priced in dollars.
When?
That’s the trillion-dollar question…
I can’t give you a date, but I can tell you what conditions I think we need to see in order for the dollar to peak and roll over.
In the near term, these boil down to the Fed appearing less hawkish than other central banks—the ECB in particular.
Longer term, the relative strength of the US economy and the rate of money-printing compared to other major economies should be the drivers.
Back to the nearer term, US inflation remaining stubbornly high (even as tracked by official CPI numbers) makes it seem unlikely that the Fed will ease up on monetary policy anytime soon. But then, the BoE was sounding just as hawkish until it blinked in the face of systemic risk. So while I don’t expect a similar about-face from the Fed this year, it’s possible the Fed will “break something” sooner than imagined, so I can’t rule it out.
I do expect the Fed to “pause” its rate hikes when it reaches the “moderately restrictive” policy level it has targeted for the end of this year. Meanwhile, across the pond, it seems the war and energy crisis in Europe will likely have the ECB still raising rates to fight inflation. If so, I’d expect the DXY to go into reverse.
If not and the Fed sticks with double tightening—QT as well as raising rates (though we haven’t seen much QT yet)—even as the economy is already weakening visibly, it’s highly probable that the Fed will break something big. That would be another “Lehman moment.” And like the BoE, I think the Fed would do a full 180 to prevent severe instability.
As I see it, the labor market—the one-legged stool the Fed’s policy is balanced on—isn’t as strong as it’s chalked up to be. The lower jobless rate reported last week is on the back of a lower labor force participation rate. This is bad, and the Fed knows it. The latest news from corporate America is that the layoffs are starting.
Earnings season starts this week. That should be quite telling on this last point.
My take is that it’s not a question of if the Fed will pivot, but when.
And even if the pivot is not for a while, I don’t think this week’s hot CPI print changes the Fed’s intention to pause and assess once it reaches its terminal rate.
Bottom Line: if the Fed slows or pauses its tightening early next year while the ECB is forced to stay hawkish, the dollar could see a sustained downturn starting in early 2023.
If the war gets out of hand and trashes the euro, it could go the other way. So I’m not making a prediction here. What I’m saying is that, given the US dollar’s overbought status, I do think the odds favor a reversal in the relatively near term.
And that should be very good for resource speculators.
This goes double if the fiscal policy response to the same conditions is to reopen the money floodgates.
This is why the main trend I’m tracking this year is which way the dollar milkshake is flowing, as evidenced by the DXY—even if they are the wrong trousers.
If I’m right, there’s huge upside in the monetary metals ahead. Quality gold and silver stocks should add leverage to this major move.
Meanwhile…
Caveat emptor,
![]()
P.S. To be kept abreast of more opportunities, dangers, and issues affecting investors, please sign up for our free, no-spam, no-hype, weekly Speculator’s Digest.