
Investors around the world are scratching their heads. Soaring US stock prices make no sense in the face of a global recession that has even mainstream financial media talking about a possible depression.
Granted, it’s not all stocks. A few big names are doing most of the heavy lifting, especially among the tech stocks on the NASDAQ.
This got me to thinking about the way some investors monitor the Dow-gold ratio—and wondering what the NASDAQ-gold ratio looks like today. So, I charted it, and found the results surprising.
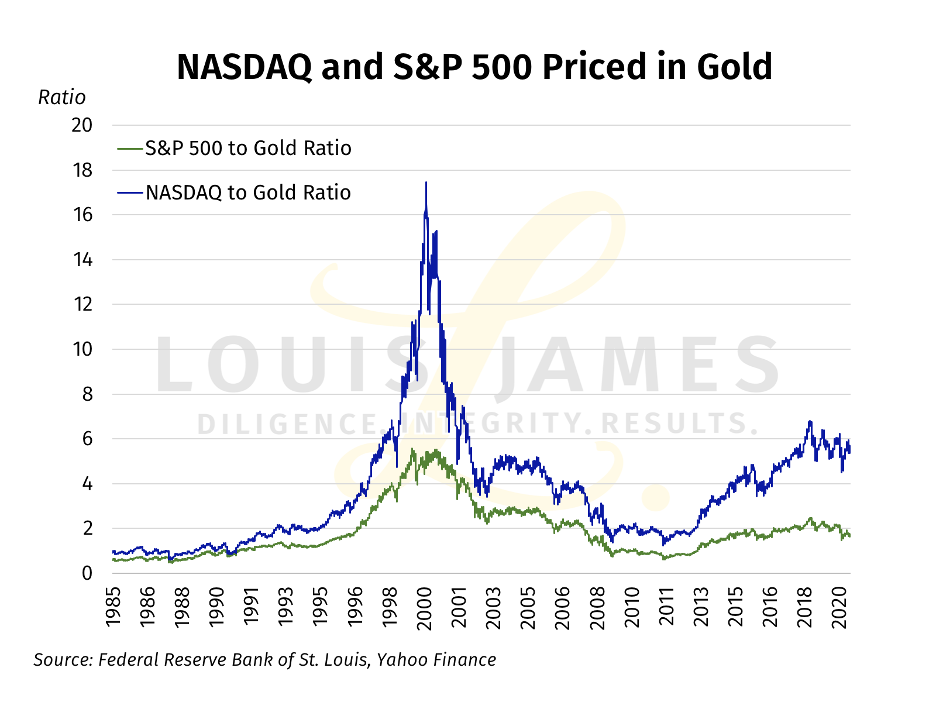
First off, note that I used the S&P 500 rather than the DJIA. It’s more representative of the overall market and economy. However, the Dow line looks much the same.
The S&P 500 line tells us that, priced in gold, most stocks are really not that expensive.
At least, they aren’t when looking at the range over the last 30 years or so.
But the really striking thing to me is how much lower that NASDAQ ratio is now than during the Dot-Com bubble in 2000.
In retrospect, I should have expected this. Gold had yet to emerge from its nuclear winter at the time. Priced in gold, stocks included in all the major indices were much more expensive than they are now, both before and after the 2000 spike.
So… What happens if we just ignore the insane 1999-2001 surge in the NASDAQ?
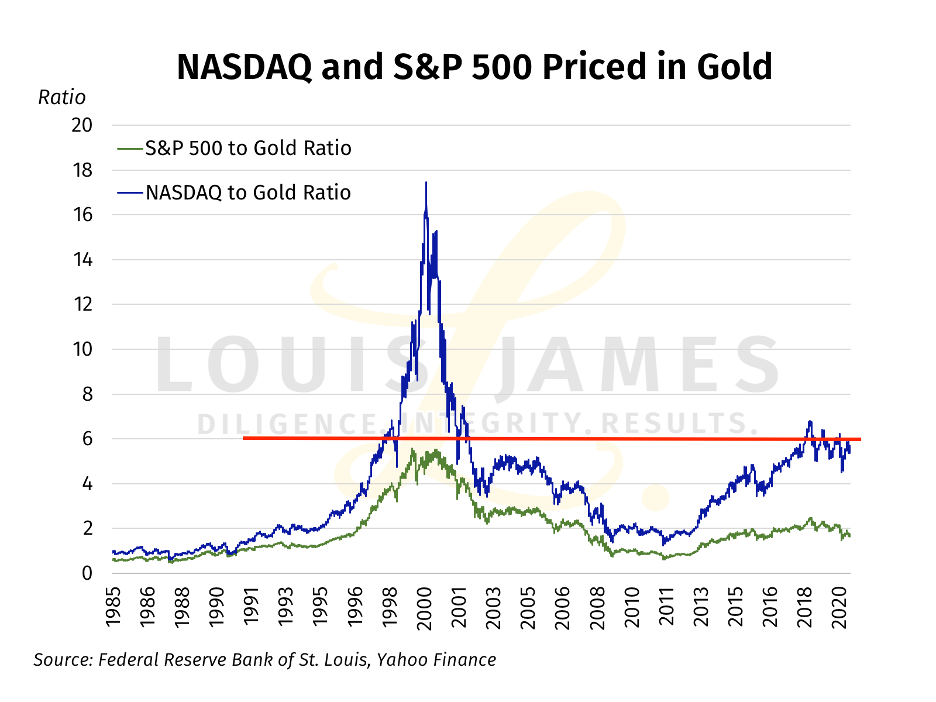
If we do that, we can see that, priced in gold, NASDAQ stocks are near all-time highs—but not as expensive as they were in 2018.
That’s what really surprised me, given the headlines about new all-time-highs.
Interesting, but what does it mean?
I could do a lot of guessing about that, but three things are clear to me:
- Overall, stocks and gold have been trending upward together—for a decade.
- The NASDAQ’s surge above the more general indices started after the post-2008 global financial crisis. Despite certain tech stocks benefitting from the “stay at home” trade, the COVID-19 shutdowns are not the main driver.
- The fact that—priced in real money, gold—stocks are below their averages since 2018 tells me that inflation is indeed happening. It’s just focused on financial assets. For now.
I have to say that, after the economic crisis before us passes, the secular trend for great tech companies looks good.
The most important takeaway for me, however, is how bullish for gold and silver this inflation trend is.
That’s actually true for stocks as well—but only as long as the party on Wall Street lasts. All the money-printing in the world won’t keep prices up if the mass psychology driving markets shifts, and people just don’t want to buy stocks anymore.
As the global economy and financial system sail deeper into uncharted waters, that makes betting on Wall Street a far riskier proposition than betting on gold.
That’s my take,
![]()
P.S. To be kept abreast of more opportunities, dangers, and issues affecting investors, please sign up for our free, no-spam, weekly Speculator’s Digest.