
I’m on the record saying that there’s a lot of money to be made speculating on the world’s adoption of a new energy paradigm. Since becoming an energy metals bull, all of them except uranium have dropped in price. Does this change my outlook?
No.
Markets fluctuate. Metals markets do so with gusto. It’s par for the course. Lower prices in the near term help us to buy low so we can later sell high.
There have been reports of developments in this space that have alarmed investors. There’s a new battery design that use less cobalt, for example, and another that gets ride of the graphite altogether. But none of these things changes the scope or direction of the global megatrend we’re talking about.
That said, it pays to be careful. A rising tide is said to lift all ships, but that won’t work for one with a big hole in its hull.
I’ve built a model for the minerals I’m interested in, to help me see what the data show and base my decisions on that—the data, not the hype.
The Model
My goal in modeling supply and demand trends for a mineral I’m interested in is to see if there’s likely to be a surplus or a deficit within a relevant time frame. As a speculator who prefers to go long than short, I want to see deficits. These are likely to push prices up.
Many analysts’ models projecting these trends look only at published production guidance for existing mines. That fails to account for new production coming on line. I understand not wanting to count production before it’s achieved. Many mining projects never get permitted. Or if they do, they take 10 years longer than expected because of ever-thickening layers of red tape.
But it’s clearly a mistake to ignore new production, so I count all new projects that have completed feasibility work and have published production profiles and startup dates. Some won’t make it, I know, but that just makes my model more conservative. Better to overestimate supply than to underestimate it, if I’m betting on higher prices.
My model also assumes an average battery size of 50 kWh. This is smaller than the 60kWh figure in my previous work, because a lot of electric and hybrid cars are using smaller batteries than the 60Kwh size Tesla uses. Again, I’m being conservative.
The mineral content of different batteries varies, so I’ve taken what seem to me to be the most reasonable averages (taking Tesla’s new, lower cobalt design into account). The figures are:
- Lithium: 0.9 kg per kWh = 45 kg per car
- Cobalt: 0.2 kg per kWh = 10 kg per car
- Nickel: 0.6 kg per kWh = 30 kg per car
- Graphite: 0.85 kg per kWh = 42.5 kg per car
I know there are more minerals involved in this story. I’m particularly interested in copper, which I’ve already covered, and silver, but its price is not primarily driven by its industrial uses.
One thing readers of my past work will notice in the charts below is that instead of predicting a single most probable case for electric vehicle (EV) adoption, I show a range of probable outcomes (scale on the right). I find this more useful than making a single projection that will almost certainly be wrong. If my full range of outcomes still tells me I’m on to a good speculation, I’m more likely to make the right bet.
The Results
Without further ado, then, here are my projections for the four energy minerals for which I have models completed.
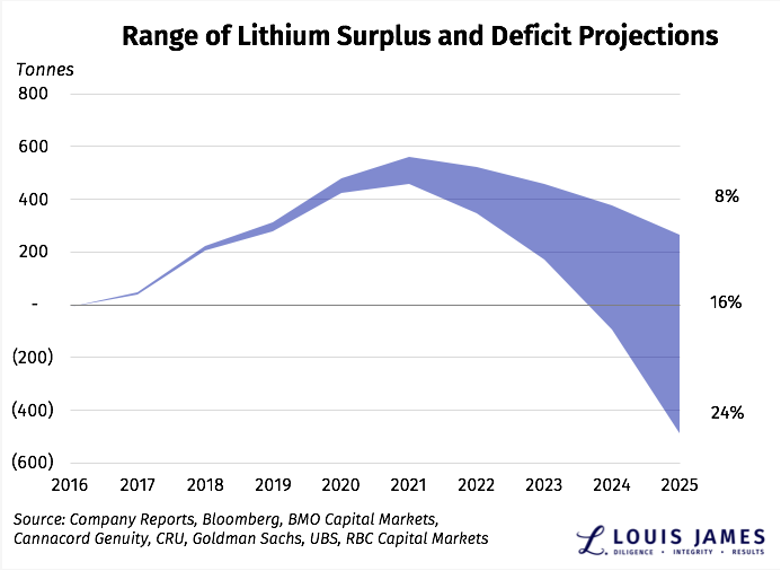
As you can see, lithium is still in a market surplus and will be for years to come. I’ve been right in calling for a substantial correction in lithium prices. The profitable producers will still make money and aren’t bad stocks to own, but that’s not where I want to put my speculative cash. I’m not interested in lithium exploration plays at all until a real supply deficit develops.
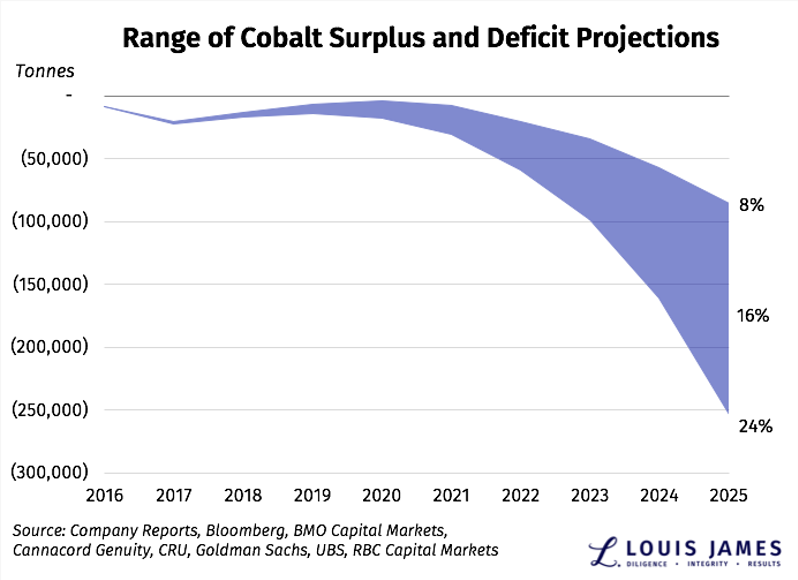
Cobalt remains one of my favorite energy minerals. It’s easy to see why: it’s already in deficit. This is true even under the most conservative assumptions. That makes its current price correction an opportunity to buy low. I’m on board and looking for great speculations in this space.
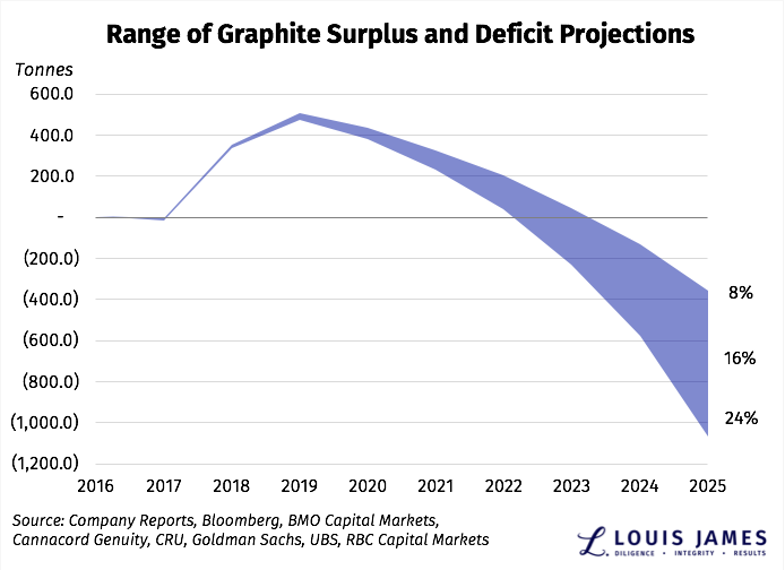
As with lithium, this chart tells you all you need to know about why I’m not a graphite bull. The day may be coming, but it could be five or six years before we see a supply deficit—and that’s long enough for new battery designs to eliminate graphite, if that’s going to happen. Until we see demand exceed supply for some time, I won’t have confidence in sustainably higher graphite prices.
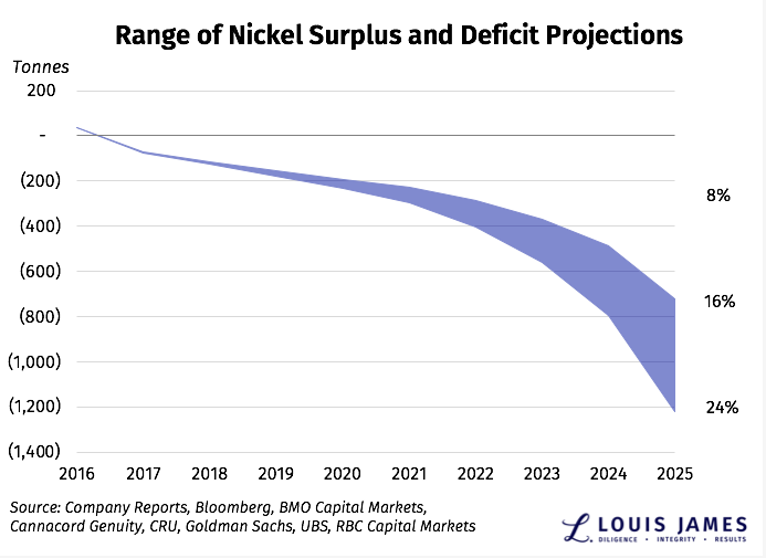
Saving the best for last, this chart shows why I’m such a nickel bull. I expect higher prices this year and for years to come. Finding the right nickel junior, however, is harder than seeing the case for nickel itself. I’m working on it.
That’s my take.
![]()