Konstantin Ogurchenkov
Extractive industries—especially mining—are different from almost all others. Unlike factories or services, mines are self-depleting. They literally become worth less with every tonne, pound, or ounce they produce.
Exploration companies, in particular, aren’t amenable to conventional securities analysis. In most cases, they have no material revenue. It’s impossible to value them using standard financial metrics; price to earnings (P/E), EBITDA, and other such financial figures make no sense in the world of mineral exploration.
Most explorers burn cash, hoping to add value by discovering minerals in the ground and advancing their projects toward production. You can’t track this progress from a company’s financial statements. This is why some of the brightest analysts, economists, and money managers struggle to understand the industry’s value propositions… and give up.
After all, without a clear understanding of a company’s value, buying shares is gambling, not investing.
But don’t give up.
Valuing exploration companies isn’t a simple task, but it’s doable. There is a way to assign a preliminary value to pretty much any mining venture—at least after the initial discovery phase. It requires no more than publicly available data and simple math skills.
Before a discovery has been defined, of course, any pretense at valuation is just a hunch. No matter how much math you throw at it, the results rest on so many assumptions and guesses that they are, at best, thought of as… aspirational goals.
When there’s at least an initial deposit in hand, we have something a little more tangible to work with.
We start with companies working on the projects with an official resource estimate for their discovery (43-101 in Canada, JORC in Australia, etc.). These come with strict definitions and reporting standards.
Keep in mind that these are only estimates; they outline the potential size and grade of a deposit. This is even true of “Proven” mine reserves. Only actual mining can prove how many tonnes of mineralized material are there. Even so, we can use these resource estimates as bases for reasonable valuation estimates.
Publicly-traded companies provide such resource estimates on their websites or official fillings. They look something like this:
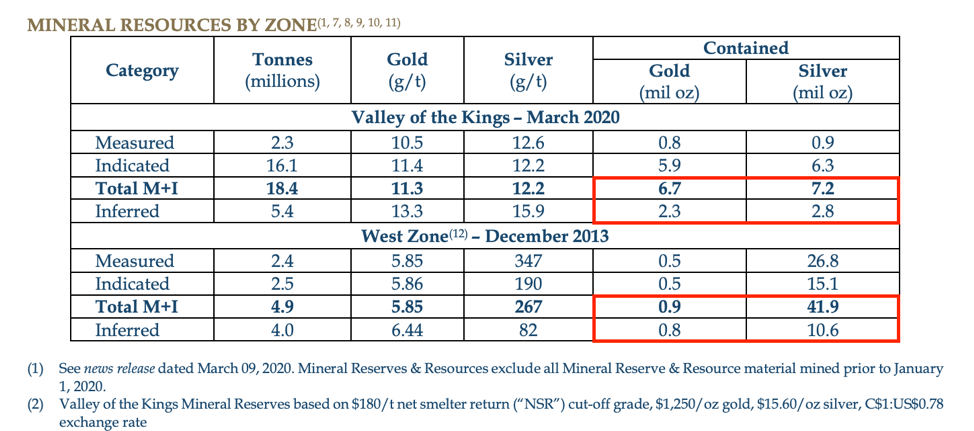
Source: Pretium Press Release
To avoid any possible suggestion of a conflict of interest, we’re using a company that was acquired and is no longer trading: Pretium Resources.
As you can see, the mineral resource estimate outlined 10.7 million ounces of gold and 62.5 million ounces of silver (the sum of the cells highlighted in red.) These ounces come from different confidence categories and are hence not equally well defined. We can add them together to better see the project’s potential.
The resource estimate was calculated using a gold price of $1,250 per ounce and $15.60 per ounce for silver. Using the same prices, we can translate the resources into a gold-equivalent (AuEq) total: 11.48 million ounces of AuEq.
That’s the first part of the equation: the size of the deposit.
Next, we need to find the value of the deposit(s). For starters, we need to determine the percentage of the project(s) the company owns. If it owns 100%, we can assign full value to the company for whatever we estimate the value of the deposit to be. Otherwise, the value needs to be adjusted to account for the ownership share.
We’ll use enterprise value (EV) to value the company. It shows total market capitalization (MCap) adjusted for cash, debt, minority interest, and preferred equity. MCap is determined by multiplying the total number of outstanding shares by the current share price.
Let’s imagine a company that wholly owns 100% of one project. It has 200 million shares trading at C$0.50 per share, C$10 million in the bank, no debt, and no preferred equity or minority interest.
Its MCap will be C$100 million, and its EV will be C$90 million.
Note that if we’re dealing with a Canadian company and shares are priced in Canadian dollars, we have to translate this into US dollars to compare its value to that of its project, because the commodities to be produced are priced in US dollars. The same goes for Australian miners or any other companies priced in non-US currencies.
With a USD to CAD exchange rate of 1.35, we get US$66.7 million in EV.
At this point, we have the size of the project and the company’s EV. This is enough to calculate the value investors are giving it per AuEq ounce in the ground, simply by dividing the EV by the number of ounces.
Our hypothetical company is trading at US$5.81 per ounce of AuEq. Not a lot compared to the current gold price of over US$2,000 per ounce, right? But mines are not vaults; it takes enormous effort and expense to extract, process, and deliver whatever they are producing.
Finding a miner producing gold below US$1,000 per ounce these days is quite a challenge. And that’s a producer with well-established reserves. For exploration companies, we should apply a discount for the project’s stage, technical and political risks, and metal(s) price volatility. Then we can see how our made-up company is valued compared to its peers.
Consider this chart of 47 active exploration and development companies and our made-up explorer (highlighted in green.)
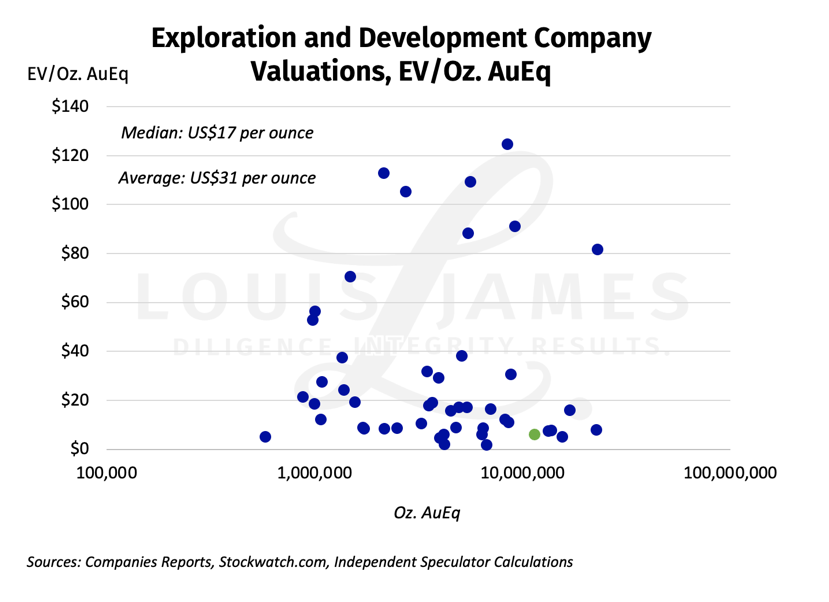
Our example is close to the bottom of the chart, way below mean or median metrics across its peers. Just to reach the median value of US$17 per ounce, the company would have to almost triple in share price. Hence, we can call this company undervalued relative to its peers.
However, not all companies and projects are alike. Some are more valuable, like those with higher grades or simple processing, which can lead to lower-cost production. Others can be lower margin, dealing with regulatory obstacles, and/or any of a host of other problems.
What appears to be a compelling value proposition is just a starting point. We then need to dig to find out why a stock is on sale, and if its valuation is an opportunity or a warning sign.
Conversely, if we see a company trading way over what its peers are getting… Well, first we double-check our math. We can all make mistakes. If the math is correct, the company is overvalued, and we need to see if it has something special to justify that. It might be a market error (perhaps the result of very aggressive promotion) or about to be liquidated.
More advanced projects have engineering and economic studies on them of one sort or another, yielding more thorough and robust estimates of net present value (NPV) and internal rate of return (IRR). We have a cheat sheet on interpreting such studies, available for free.
Economic studies are much easier to compare to a company’s EV—but it takes years to get to that stage. Peer comparisons are about all we have for earlier-stage companies.
Our team has examined over 600 resource companies and assigned them positive or negative evaluations: a clear thumbs-up or thumbs-down in our My Take service. We have a thorough due diligence process based on multiple factors, including company valuations. However, as noted, even some companies that seem overvalued at first glance could have the potential for strong gains.
In fact, some of the companies from the chart above have a thumbs-up in My Take. I’ve highlighted a few of these in yellow.
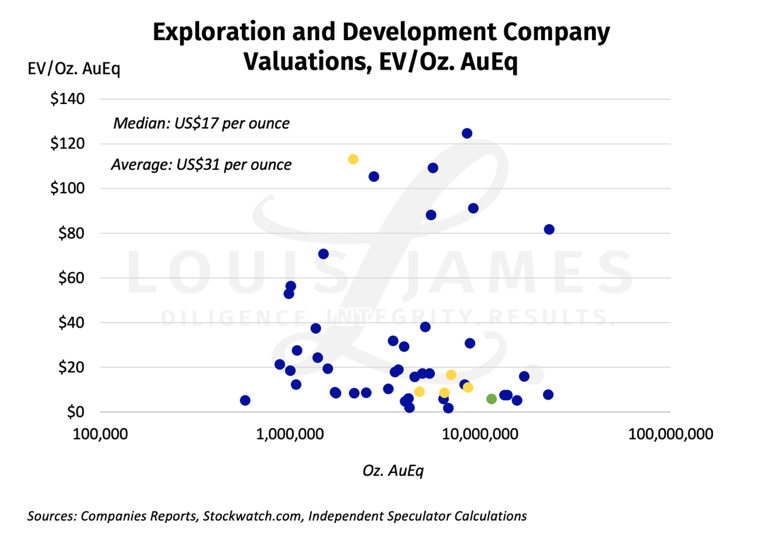
If you’re interested in my takes on these companies, you’re welcome to subscribe.
But this “comp valuation” idea is yours free of charge.
Anyone can do the same math on a group of comparable companies to see how those they’re interested in stack up.
Or, even without a particular company in mind, one can do the same math on all the companies of a type one is interested in, to see if there are any outliers. Those may be great opportunities… or not. But this method will tell you where to start digging for more information.
Due diligence is never optional.
KO
P.S. To be kept abreast of more dangers, opportunities, and issues affecting investors, please sign up for our free, no-hype, no-spam, weekly Speculator’s Digest.