
by Kyle Johnson
Economic data are critical for investors, but can be deceiving. Here are some important episodes that would leave most scratching their heads.
The Great Depression and World War II
The 1940s provide one of the most fascinating case studies in economic history.
Unemployment was at 14.6% in 1940. By 1944, it was at just 1.2%. Many credit the war effort and Rosie the Riveter. They overlook the impact of shipping millions of men overseas to battle.
Gross National Product (now known as Gross National Income) skyrocketed between 1939 and 1945. Economists estimate it rose anywhere between 14 and 89%. This historic “growth” occurred when the most experienced and skilled laborers left their jobs. They were replaced by the very young, the very old, and women—most of whom had little or no prior training or experience. Women can’t be brought into the workforce today, as they’ve never left. That leaves child and elderly labor. Even if such a recipe for economic growth were politically viable, I’d argue that it represents a decrease in quality of life that was previously only accepted as a war-time measure.
By 1946, the war had ended and men returned home. Economists predicted mass unemployment and a stagnant economy that would be unable to handle a massive influx of workers. Wartime budgets were slashed. Many datasets show a significant drop in GNP.
However, the economy didn’t tank. Quite the opposite. Private sector production increased by nearly 33%—the first increase in 18 years and the largest single increase in US history.
Dot-Com to Housing
Dialup internet and free-trial AOL CDs seem nearly prehistoric today. But the time when they abounded was the golden era of nonsensical P/E ratios. Seemingly, any company with “dot-com” in the name could be the next big thing.
Many talk about the dot-com bubble “bursting” … but where? The GDP data might surprise you.
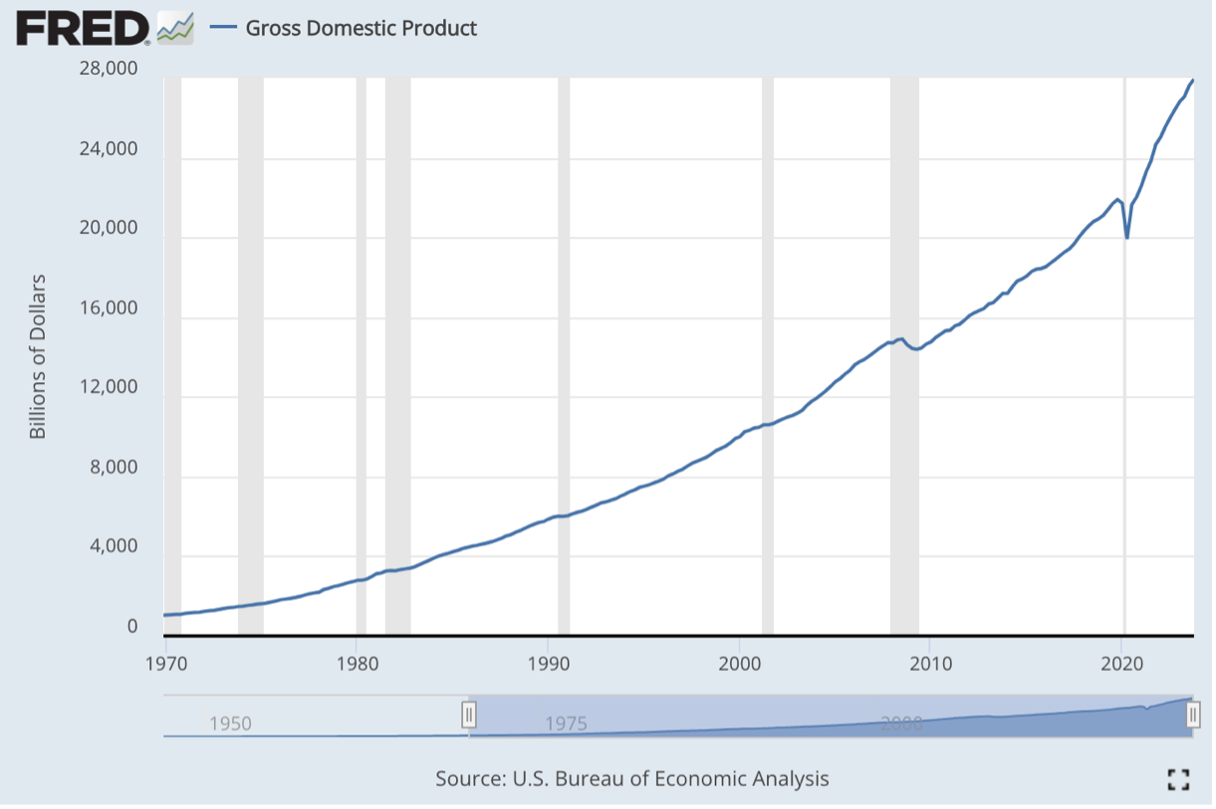
The brief pause during the Dot-Com Crash would be dismissed as a hiccup today. Nevertheless, Alan Greenspan responded with a huge policy shift—lowering interest rates and flooding the economy with cheap money. Housing prices took off, resulting in the popular opinion that “housing doesn’t decline during a recession.”
You know what happened next… pop goes the housing bubble.
But you might not remember how long it took for it to show up in key statistics, such as unemployment:
- January 2006: 4.7%.
- January 2007: 4.6%.
- January 2008: 5.0%.
- January 2009: 7.9%.
GDP didn’t go negative in the GFC until long after many institutions went bust.
A Not-So-Hypothetical
Let’s play a game.
Pretend for a moment that unemployment jumped to 12%, and economic output declined by 17%.
What do you think would happen if tax rates were cut for everyone?
What if the national debt were reduced by one-third?
You’ve probably heard of the Roaring ‘20s. Well, this was how it actually began: a spike in unemployment and nosedive in economic output.
The response was budget cuts rather than stimulus. Tax cuts, not hikes.
The result?
Unemployment fell from 14.6% to just 6.7 % in 1921. By 1923, it was just 2.4%.
This turnaround is even more impressive after recognizing that the Fed began its first-ever open market operations in 1922.
This episode turns modern economic convention on its head. Can you imagine Congress and the Fed responding the same way today?
This history also suggests that stimulus and “help” from the Powers That Be (TPTB) might actually prolong economic downturns.
This is why investors must not only be able to decode official data but also understand how the government and Fed are likely to respond… and what the ultimate result would be.
Not easy.
New Metrics?
It’s tempting to assume that everything I’ve discussed is ancient history. That we’re more sophisticated now. We have more data. Better data. But it’s dangerous to assume modern statistics are any better.
How many “data-driven” economists and financial commentators were right about uranium in 2023? How many warned of recession? How many warned of more banking collapses? Not that they were foolish for interpreting the data this way; Silicon Valley Bank was the third-largest bank failure in US history. Only massive intervention prevented more dominoes from falling.
It’s official policy to use subjectivity in economic data—such as qualitative hedonic adjustments when “measuring” inflation. Moreover, the basket of goods they use to study prices is not fixed. Are we to believe they are selected at random? Of course not. The discrepancies between published data and revised data are also not random.
I’m not saying data are irrelevant. Nor am I saying that you need to be glued to your screens 24/7, prepared for a black-swan event. But you might want to be open to judiciously filtering data from on high.
Official data can be deceiving. And conventional economic wisdom in response to data can easily prove dangerous.
Stop and appreciate where we are today. Debt-servicing payments indicate that the bill for decades of irresponsible spending is coming due. It’s becoming the largest budget item—rivaling Defense Department spending.

And the mere suggestion of trivial cuts is deemed DOA in Congress.
TPTB are attempting to revert to the mean after years of ZIRP. Many think they can escape disaster with a soft landing—some even think there will be no landing at all.
My prediction?
Unfortunately, my best answer is the least satisfying—I’m not sure what will happen. Lobo thinks we’re headed for a brief, hard landing before the easy-money floodgates open again in response. Regardless, I hope you now recognize that official data might not be your best guide.
Being liquid, flexible, and contrarian seems like a good recipe for 2024.
KJ
PS: Lobo’s highest-conviction trades for 2024 are gold and uranium. We might even see exciting moves in copper and silver this year as well. To learn more, consider subscribing to our free, no-hype, no-spam newsletter—the Speculator’s Digest.